Decisions in business are better taken with evidence, data and notion about the risks and opportunities involved. Period. There is no workaround for this. Control systems in our business helps see and appreciate options that makes us aware what is going on, both in our internal and external environment. Let's read about this topic and how we can apply to our work.
Check out the first blog post in this series.
Evolution of Computerised Decision Support to Analytics

The focus we have today on analytics and data science has deep roots in the past century has analyzed by Sharda et al., 2018. With every step made, innovation in management was achieved. In the 1970s the primary focus of information systems support for decision making focused on providing structured, periodic reports that a manager could use for decision making (or ignore them). These reports became regular in order to inform about performance in previous periods. The late 70s saw the appearance of Decision Support Systems (DSS), which were interactive computer systems based on data which helped decision makers. At that time, data was mainly collected from experts in the form of interview or questionnaire.
In the 1980s, the disjoint reports performed were integrated as enterprise-level information systems that we now commonly call enterprise resource planning (ERP) systems. Data representation also suffered changes with the Relational Database Management (RDBM), which showed the need to have standards, for example ordered tables with related information. Data integrity became an issue as it became important to make informed decisions, for example, about a relationship with a client.
In the 1990s, the need for more versatile reporting led to the development of executive information systems (EISs; DSSs designed and developed specifically for executives and their decision-making needs). At this time, a repository for data was a requirement as Data Warehouses (DW) appeared. In the 2000s, the DW-driven DSSs began to be called BI systems. As the amount of longitudinal data accumulated in the DWs increased, so did the capabilities of hardware and software to keep up with the rapidly changing and evolving needs of the decision makers.
The 2000s also brought techniques such as text or data mining as methods to improve data treatment and obtain further insights from data. The amounts of data available from the 2010s onwards increased substantially compared to the previous ones. This was mainly due to the widespread use of the internet and social networks. This unstructured data is rich in information content, but analysis of such data sources poses significant challenges. The term Big Data highlights the challenges that these new data streams have brought. Although it is hard to predict what the future will bring in terms of analytics, it is certain the interest in this topic and the use of data as a huge opportunity to make better decisions and increase revenue.
How Amazon uses data, AI and machine learning in their fulfillment centers
Business Intelligence for Control Systems for Business
Business intelligence (BI) is an umbrella term that combines architectures, tools, data-bases, analytical tools, applications, and methodologies. It is a content-free term which can mean different things to different people. BI’s major objective is to enable interactive access (sometimes in real time) to data, to enable manipulation of data, and to give business managers and analysts the ability to conduct appropriate analyses. This will lead to informed decisions based on data and valuable insights. The process of BI is based on the transformation of data to information, then to decisions, and finally to actions.

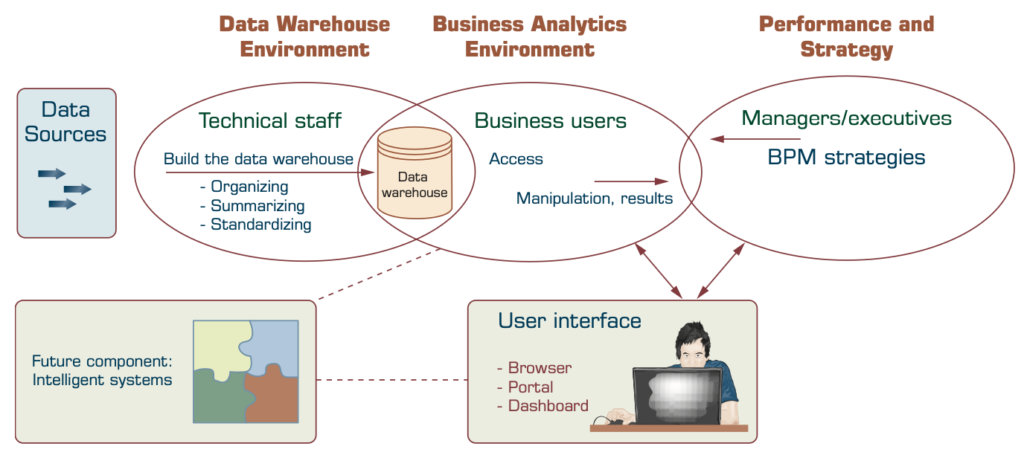
A BI system has four major components: a Data Warehouse, with its source data; business analytics, a collection of tools for manipulating, mining, and analyzing the data in the DW; Business Process Management (BPM) for monitoring and analyzing performance; and a user interface (e.g., a dashboard).

The fundamental reasons to invest in BI must be linked to the organizations’ business strategy. BI cannot simply be a technical exercise for the information systems department. It must serve as a way to change the manner in which the company conducts business by improving its business processes and transforming decision-making processes to be more data driven. The process to adopt BI initiatives might be complex due to all the requirements it involves (having skilled personnel, willingness to change or create useful and agile systems).
Business Analytics for Control Systems for Business
Although many times the word analytics if confused with BI, it has a slightly different meaning. analytics as the process of developing actionable decisions or recommendations for actions based on insights generated from historical data. According to the Institute for Operations Research and Management Science (INFORMS), analytics represents the combination of computer technology, management science techniques, and statistics to solve real problems. SAS Institute Inc. proposed eight levels of analytics that begin with standardized reports from a computer system. These reports essentially provide a sense of what is happening with an organization. Additional technologies have enabled us to create more customized reports that can be generated on an ad hoc basis.
This idea of looking at all the data to understand what is happening, what will happen, and how to make the best of it has also been encapsulated by INFORMS in proposing three levels of analytics. These three levels are identified as descriptive, predictive, and prescriptive.

Will you make the right Decision?
Business decisions must be informed and based on data. In this case of an issue connecting flights, a company must take a decision on the costumers to benefit. It should be based on the costumer’s historical purchases as well as on the future prospected revenue the costumer will bring.
Strategy, Reports and Dashboards used in Control Systems for Business
By now, we know that data plays a very important role in management, particularly in strategic management. When managers have to take a decision, they need to do it in a very informed way and data is the source of that information. Recall the strategic control section and the need to monitor de strategic implementation: check the status of the projects, achievement of milestones or building a Balanced Scorecard. How can this task be completed? With the help of data.
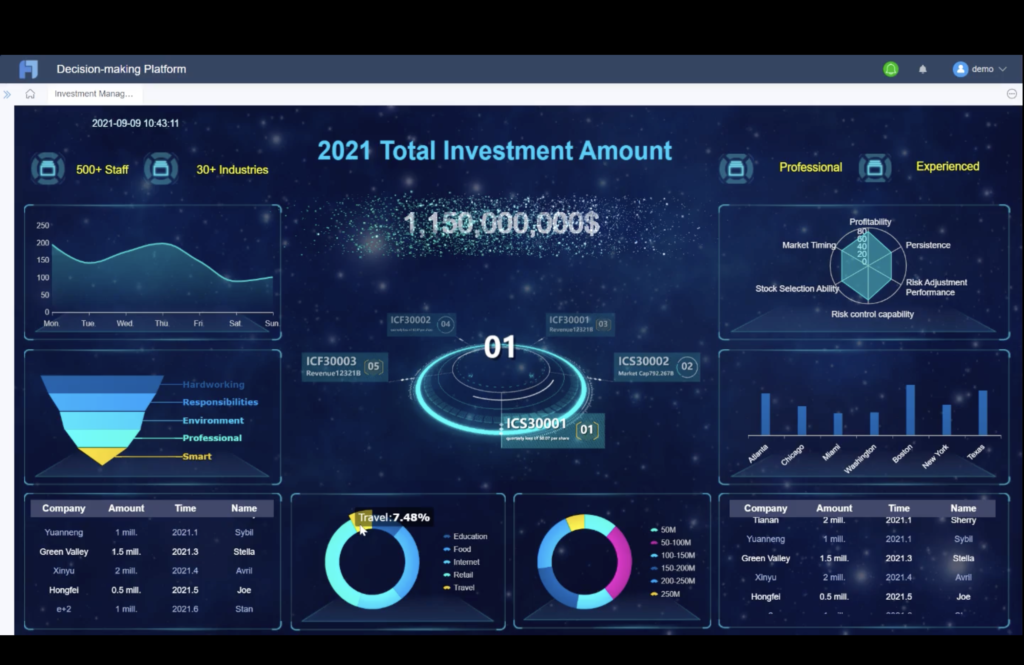
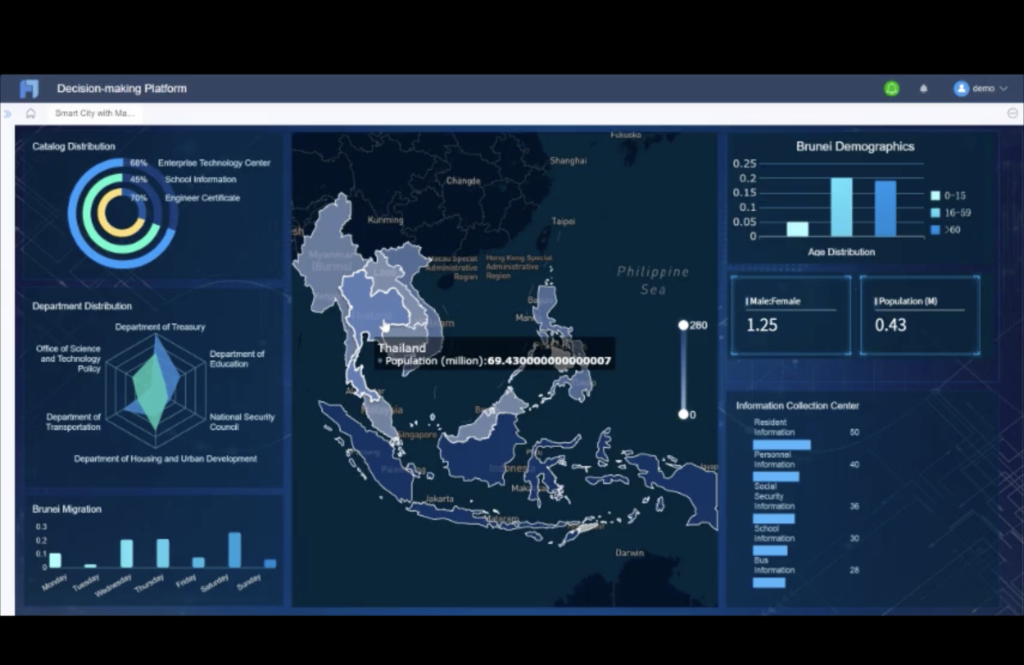
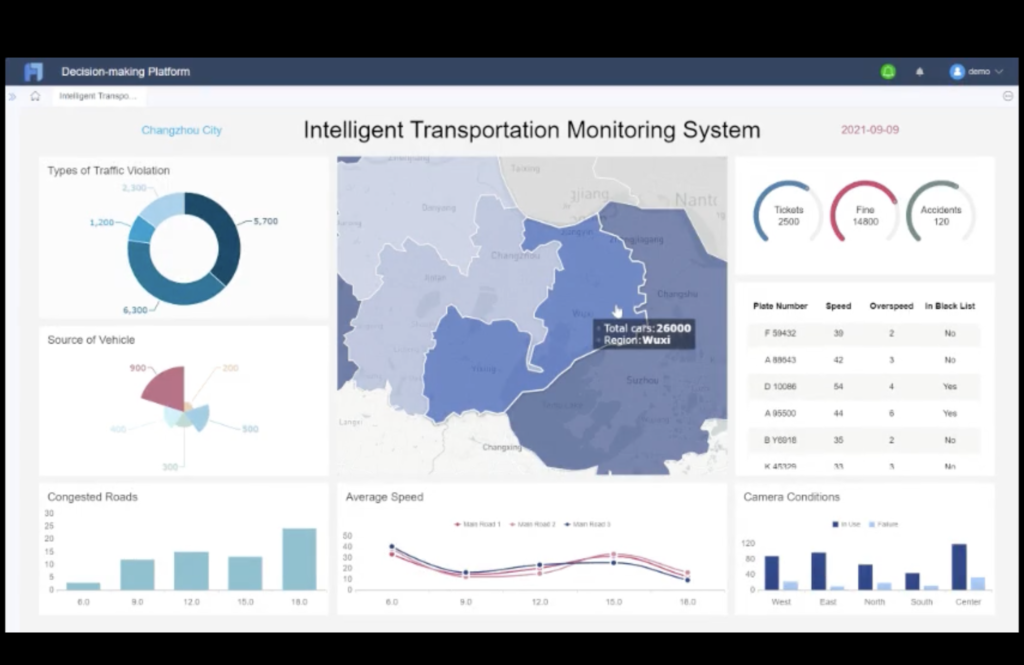
Therefore, data visualization becomes essential. Data by itself has no meaning and we need to be able to present it to make sense of it. Data can be presented with dashboards which managers can easily use to get information. A business dashboard is a graphical display of various indicators, reflecting the operating status of the enterprise in real-time and visualizing the collected data. Dashboards are usually fed by a database and once this database is updated regularly, they will have real-time information. Dashboards are an upgraded version of graphs and static information. Dashboards tend to be dynamic in the sense that users can manipulate them as they wish to obtain certain information. The same information could be obtained in the form of simple graphs using Excel or any other statistical software. Nevertheless, dashboards tend to be cleaner, more compact, interactive and appealing than other data visualization tools. This section is built with the help of FineReport.com which is a data visualization tool. However, dashboards can be built using other tools which require more or less code writing, such as, R-Studio (with the help of Quarto or RMarkdown), Tableau or Microsoft Power BI.

Types of dashboards in Control Systems for Business
Depending on the purpose, business dashboards will have different formats and different ways to display information. There are mainly 3 types of dashboards:
- Strategic: allow users to quickly obtain and visualize the operations of the company, and to make decisions based on this, to summarize the past or to formulate strategic goals for the future. This information does not need to be real-time but it is crucial to be updated.

- Analytical: here managers cannot only see the surface information, but also investigate the causes of surface phenomena through data drilling, linkage or filtering. The objective is to investigate a phenomena and find the cause, for example, why are the sales going down? Thus, all the information regarding that phenomena must be present in the dashboard to allow conclusions. These dashboards are more directed to middle-managers as they can have operational (e.g.: productivity) or strategic (e.g.: sales per region) information.
- Operational: emphasizes continuous and real-time information reporting with data from daily activities. The main objective is to track performance and understand if it meets the desired standards. Examples are:
- KPI monitoring: monitoring of key performance indicators such as production defects or production time.
- Threshold warning: alert the user of a threshold violation, for example, the production time is exceeding by 10% the established KPI.
- Real-time data monitoring: some businesses require real-time monitoring such as foreign exchange rates.

Control Systems for Business in Action: Data and Sports
Control systems for business like sports industry has taken advantage of the new technologies, in particular, from data and machine learning. From techniques to predict games’ results to analysis of players’ performances, the sports industry has seen a great evolution on this field with data playing an important role on companies’ decision making. For example, the teams could analyse through data and not only feelings, what would be the best field position for a player.
References and Results
Main
- Barney, J. & Hesterley S. (2019). Strategic Management and Competitive Advantage: Concepts and Cases. 6th Edition, Pearson.
- Grant, R. (2018). Contemporary Strategy Analysis. 10th Edition. Wiley.
Secondary
- Adam Brandenburger and Barry J. Nalebuff, Co-opetition (New York, NY: Doubleday, 1996)
- Barney, J. (1991). Firm Resources and Sustained Competitive Advantage. Journal of Management.
- Bredrup, H. (1995). Competitiveness and Competitive Advantage. In: Rolstadås, A. (eds) Performance Management. Springer, Dordrecht.https://doi.org/10.1007/978-94-011-1212-3_3
- Boddy, D. (2020). Management: Using Practice and Theory to Develop Skill (8 ed.). Reino Unido: Pearson.
- Carroll, A. B. (1999). Corporate Social Responsibility: Evolution of a Definitional Construct. Sage. (direct link)
- Carroll, A.B. Carroll’s pyramid of CSR: taking another look. Int J Corporate Soc Responsibility 1, 3 (2016). https://doi.org/10.1186/s40991-016-0004-6
- Casadesus-Masanell, R. (2014). Introduction to Strategy. Harvards Business Publishing
- Dess, G. G., Lumpkin, G. T., & Eisner, A. B. (2010). Strategic management: Text and cases. New York: McGraw-Hill Irwin.
- Lacaze, A., & Ferreira, F. (2020). Adding Value to the VRIO Framework using DEMATEL. Lisbon: ISCTE-IUL. (direct link)
- Levitt, T. (1958). The dangers of social responsibility (pp. 41–50). Harvard business review
- Kim, W. C., & Mauborgne, R. (2004). Blue Ocean Strategy. Harvard Business Review. (direct link)
- Miller, D. (1992), “The Generic Strategy Trap”, Journal of Business Strategy, Vol. 13 No. 1, pp. 37-41.https://doi.org/10.1108/eb039467
- Nagel, C. (2016). Behavioural strategy and deep foundations of dynamic capabilities – Using psychodynamic concepts to better deal with uncertainty and paradoxical choices in strategic management. Global Economics and Management Review, 44-64. (direct link)
- Pearce, J. and Robinson, R. (2009), Strategic Management – Formulation, Implementation and Control, 11th edition, McGraw-hill International Editions
- Porter, M. E. (1979). How Competitive Forces Shape Strategy. Harvard Business Review. (direct link)
- Porter, M. E. (1985). The Competitive Advantage: Creating and Sustaining Superior Performance. NY: Free Press
- Porter, M. E. (1998). Competitive Strategy: Techniques for Analyzing Industries and Competitors. New York: Free Press.
- Porter, M.E., & Kramer, M.R. (2011) ‘Creating shared value’, Harvard Business Review, vol. 89, no. 1/2, pp. 62–77.
- Sharda, R., Delen, D., & Turban, E. (2018). BUSINESS INTELLIGENCE, ANALYTICS, AND DATA SCIENCE: A Managerial Perspective. Pearson.
- Teece, D. J. (2011). Dynamic capabilities: A guide for managers. Ivey Business Journal. (direct link)
- Teece, D. J., Pisano, G., & Shuen, A. (1998). Dynamic capabilities and strategic management. Strategic Management Journal. (direct link)
- Treacy, M., & Wiersema, F. (1993). Customer Intimacy and Other Value Disciplines. Harvard Business Review. (direct link)
- Wernerfelt, B. (1984). The Resource-Based View of the Firm. Strategic Management Journal.
Websites
- https://ebrary.net/99185/business_finance/which_prioritie
- https://managementweekly.org/porters-generic-competitive-strategies/
- https://pitchbook.com/news/articles/bezos-is-coming-mapping-amazons-growing-reach
- https://www.business-to-you.com/ansoff-matrix-grow-business/
- https://www.business-to-you.com/levels-of-strategy-corporate-business-functional/
- https://www.business-to-you.com/porter-generic-strategies-differentiation-cost-leadership-focus/
- https://www.business-to-you.com/value-disciplines-customer-intimacy/
- https://www.business-to-you.com/vrio-from-firm-resources-to-competitive-advantage/
- https://businessjargons.com/internal-environment.html
- https://www.finereport.com/en/data-visualization/a-beginners-guide-to-business-dashboards.html
- https://online.hbs.edu/blog/post/change-management-process


